DLの最初に使われるデータ例が、ほとんどの場合、iris(アヤメ)のデータだ。
3種類のアヤメについて、花びらの長さと幅、がくの長さと幅のデータが、それぞれのアヤメの種類に対して50組ずつデータがあり、全体で150組のデータがある。
これから学習データとテストデータに分けて、学習後、テストデータによりアヤメの種類を正しく分類できるかようになっているか調べるのであった。
でも、これには飽きたので、他のデータで試したい。
そのためには、まず、アヤメのデータがどこに存在し、どのように利用されているかを調べないとダメだ。
この中で肝心なのは最初に1行で、datasetsをインポートし、その中からirisのデータを読み込んでいることが分かる。
そして、scikit-learnのサイトにたどりついた。


とりあえず、データの取得が出来たので、今回はここまで。
3種類のアヤメについて、花びらの長さと幅、がくの長さと幅のデータが、それぞれのアヤメの種類に対して50組ずつデータがあり、全体で150組のデータがある。
これから学習データとテストデータに分けて、学習後、テストデータによりアヤメの種類を正しく分類できるかようになっているか調べるのであった。
でも、これには飽きたので、他のデータで試したい。
そのためには、まず、アヤメのデータがどこに存在し、どのように利用されているかを調べないとダメだ。
from sklearn import datasets
iris = datasets.load_iris()
X = iris.data.astype(np.float32)
Y = iris.target
N = Y.size
Y2 = np.zeros(3 * N).reshape(N,3).astype(np.float32)
for i in range(N):
Y2[i,Y[i]] = 1.0
この中で肝心なのは最初に1行で、datasetsをインポートし、その中からirisのデータを読み込んでいることが分かる。
そして、scikit-learnのサイトにたどりついた。

この中のドキュメントに、それらしい情報があった。
データが1797個あり、1つのデータは64個のデータからなる。
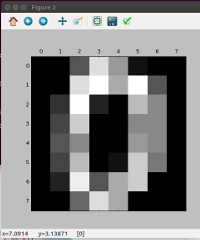
matplotlibで最初のデータを表示している。
1つのデータは64個の値からなるのだが、実際は8×8の画像データであることが分かる。
実際に最初のデータの内容を以下のようにして数値で見ると、画像との対応がよく分かる。
5.2. Toy datasets
scikit-learn comes with a few small standard datasets that do not require to download any file from some external website.
load_boston([return_X_y])Load and return the boston house-prices dataset (regression). load_iris([return_X_y])Load and return the iris dataset (classification). load_diabetes([return_X_y])Load and return the diabetes dataset (regression). load_digits([n_class, return_X_y])Load and return the digits dataset (classification). load_linnerud([return_X_y])Load and return the linnerud dataset (multivariate regression). These datasets are useful to quickly illustrate the behavior of the various algorithms implemented in the scikit. They are however often too small to be representative of real world machine learning tasks.
この中のload_irisが呼び出されていたのだ。
これを他のものに変えて、元のプログラムをちょっとだけ変更して、動くかどうか確かめよう。
上の表のloadメソッドをクリックすると、それぞれの説明が現れる。説明から、iris to digits がclassificationのためのデータらしいので、とりあえず同じタイプのdigitsを使うことにしよう。
とりあえず、load_digitsに載っているサンプルでデータのロード表示をしてみよう
from sklearn.datasets import load_digits
>>> digits = load_digits()
>>> digits.data.shape
(1797, 64)
>>> import matplotlib.pyplot as plt
>>> plt.gray()
>>> plt.matshow(digits.images[0])
<matplotlib.image.axesimage object="" at="" 0x7f5c88085a90>
>>> plt.show()

>>> X = digits.data.astype(np.float32)
>>> X[0].reshape(8,8)
array([[  0.,   0.,   5.,  13.,   9.,   1.,   0.,   0.],
[  0.,   0.,  13.,  15.,  10.,  15.,   5.,   0.],
[  0.,   3.,  15.,   2.,   0.,  11.,   8.,   0.],
[  0.,   4.,  12.,   0.,   0.,   8.,   8.,   0.],
[  0.,   5.,   8.,   0.,   0.,   9.,   8.,   0.],
[  0.,   4.,  11.,   0.,   1.,  12.,   7.,   0.],
[  0.,   2.,  14.,   5.,  10.,  12.,   0.,   0.],
[  0.,   0.,   6.,  13.,  10.,   0.,   0.,   0.]], dtype=float32)
>
とりあえず、データの取得が出来たので、今回はここまで。


